
🚕 Uber Data Analytics Pipeline
End-to-End Data Engineering on Google Cloud Platform
ETL Orchestration | BigQuery Analytics | Real-Time Reporting
Project Overview
Built an end-to-end data engineering pipeline to analyze Uber-like trip data on Google Cloud Platform. The workflow uses Mage.ai to orchestrate ETL in Python/SQL, stages raw files in Cloud Storage, runs pipeline compute on a GCP Compute Instance, loads curated datasets into BigQuery, and powers analytics-ready reporting in Looker Studio.
The project models the dataset for efficient analytics (fact/dimension style), includes reusable SQL queries for insights, and is based on the NYC TLC trip record dataset (yellow/green taxi trips with pickup/dropoff, fares, distances, payment type, passenger count, etc.).
📊 Dataset: NYC Taxi & Limousine Commission (TLC) Trip Records — millions of taxi trips with rich attributes including temporal, spatial, and transactional data.
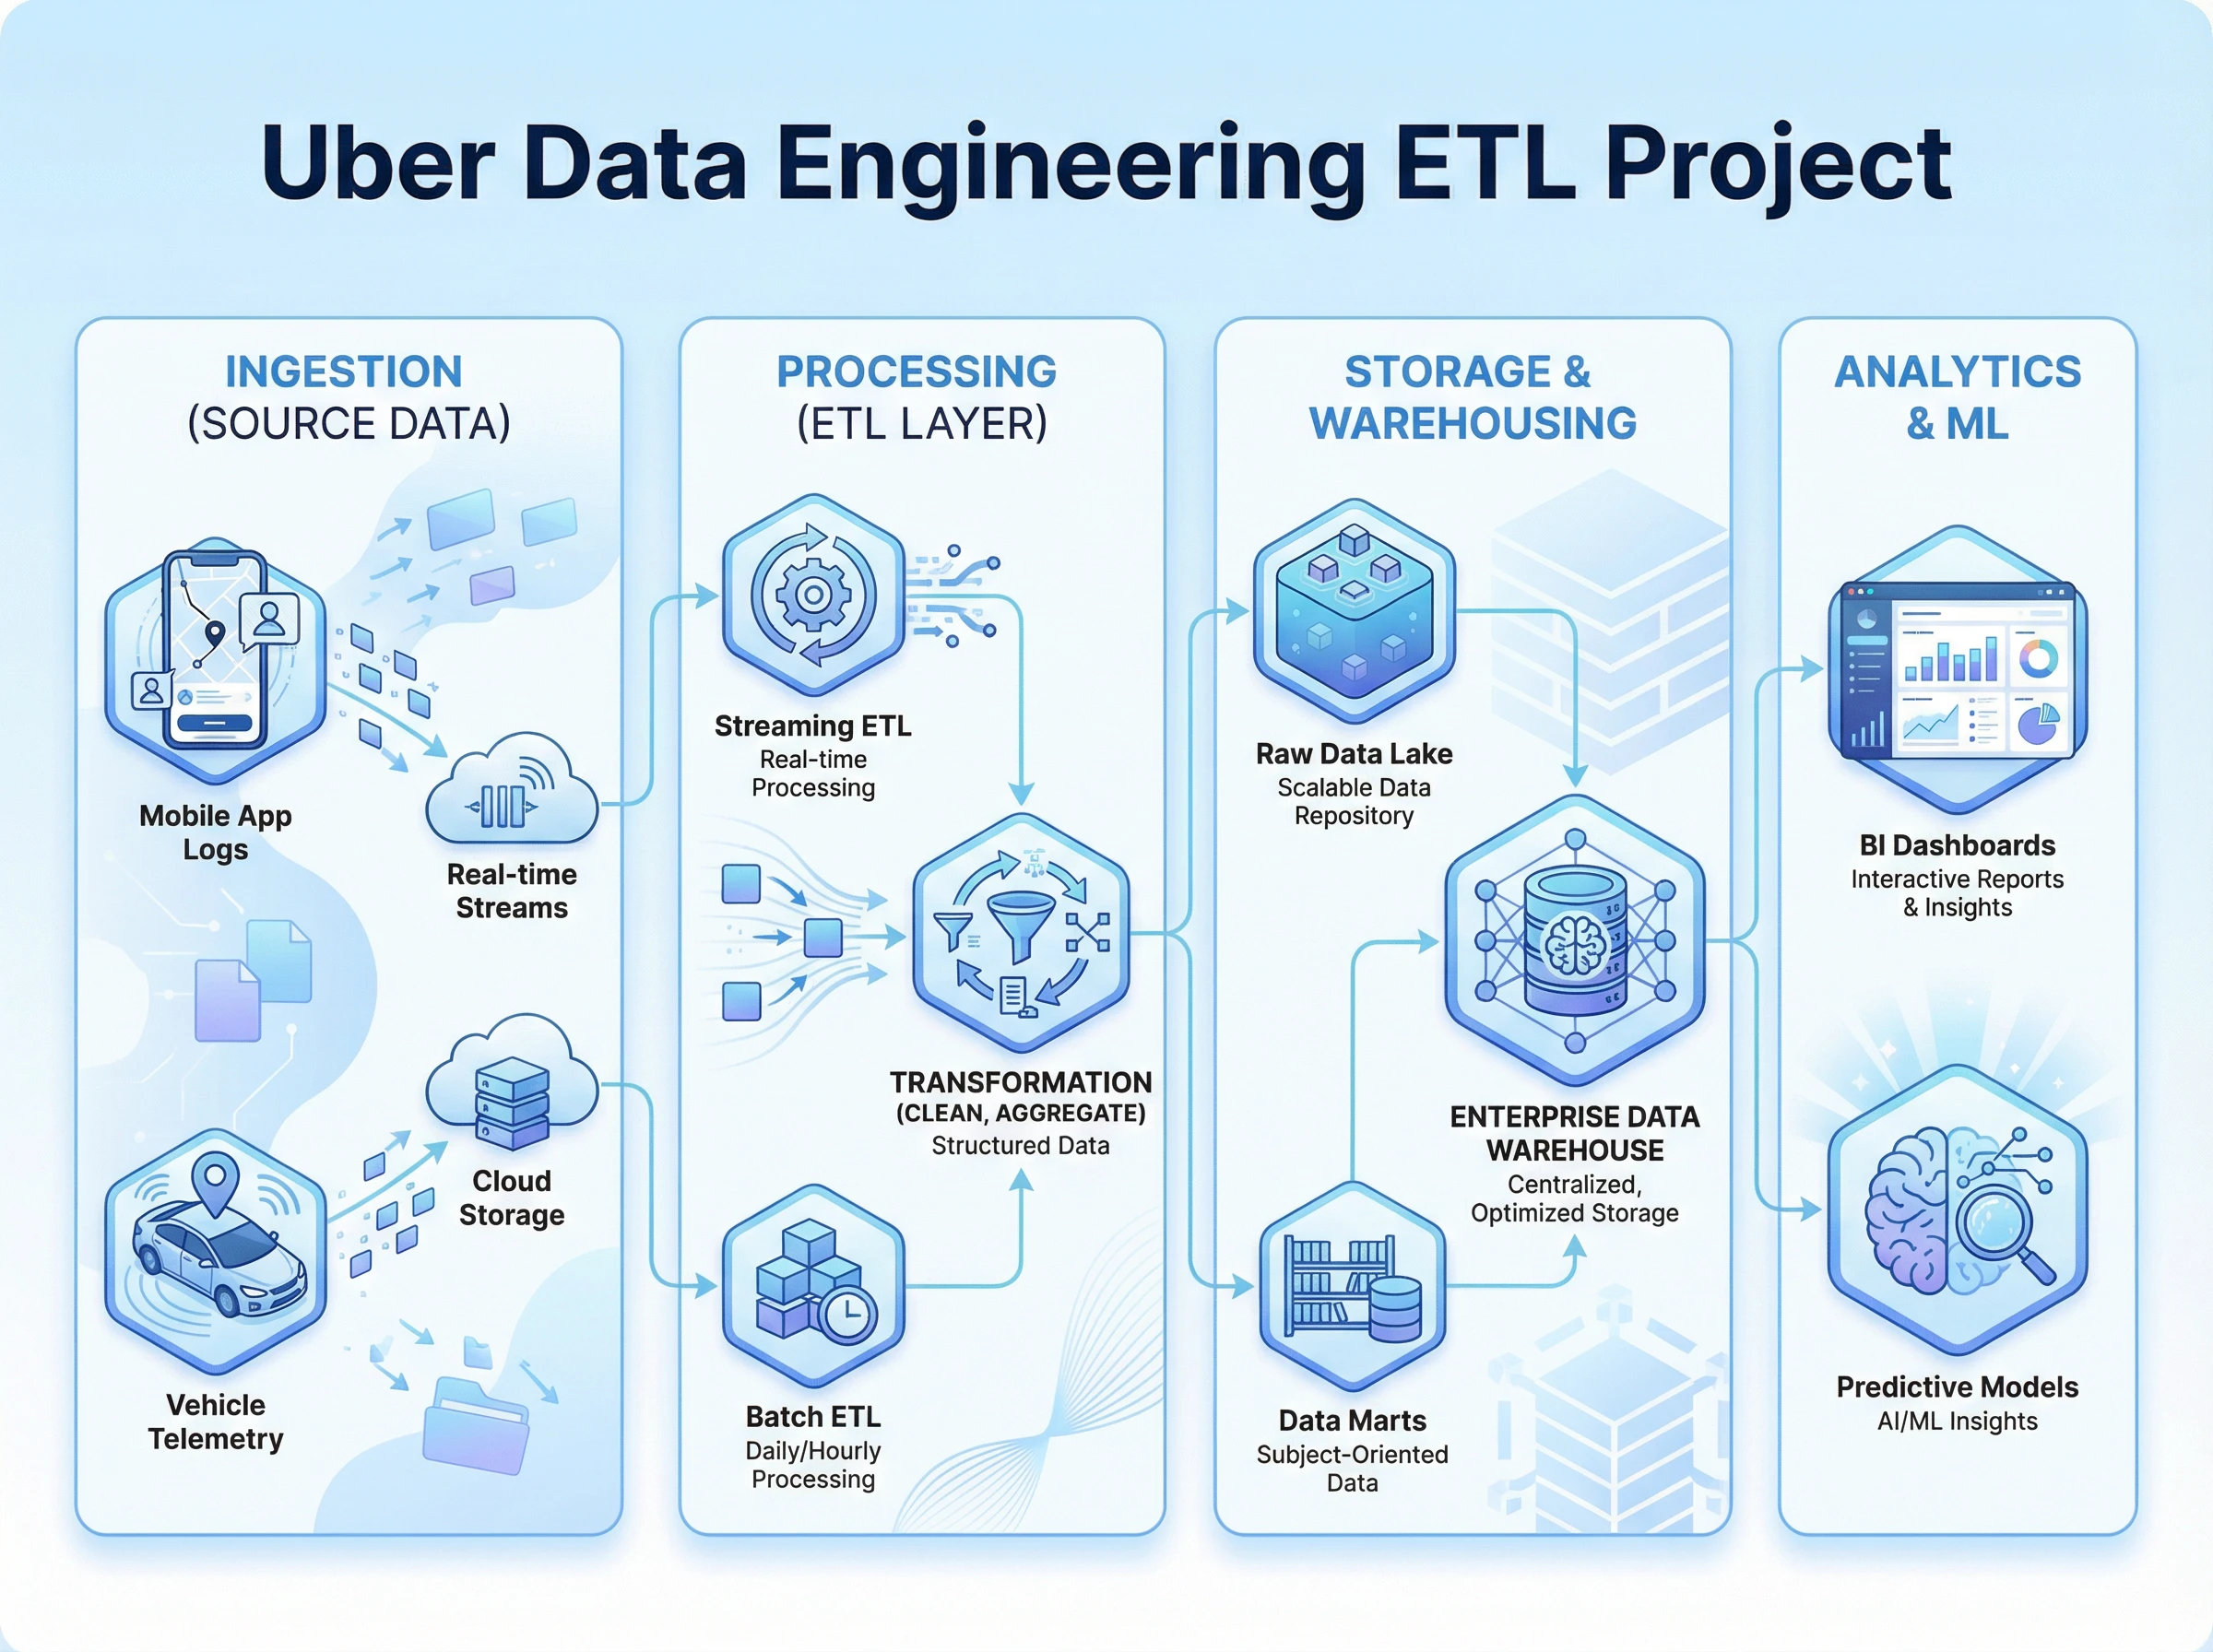
Pipeline Architecture
🖥️ Infrastructure
Compute Engine Instance: Hosts Mage.ai orchestration server, executes Python/SQL transformations, and manages pipeline scheduling.
Key Features & Capabilities
Automated ETL Pipeline
Mage.ai orchestrates Extract-Transform-Load workflows with scheduled runs, error handling, and data validation checkpoints.
Dimensional Data Modeling
Star schema design with fact tables (trips) and dimension tables (datetime, location, payment, rate) for optimized analytics queries.
Scalable Cloud Storage
GCP Cloud Storage acts as data lake for raw CSV files with versioning, lifecycle policies, and cost-effective archival.
BigQuery Analytics
Serverless data warehouse enabling SQL queries on millions of rows with sub-second response times and petabyte scalability.
Interactive Dashboards
Looker Studio dashboards with real-time KPIs, trend charts, geographic heatmaps, and drill-down capabilities for stakeholders.
Reusable SQL Queries
Pre-built SQL templates for common business questions: revenue analysis, peak hours, popular routes, payment trends, and more.
Data Model Architecture
📊 Fact Table: Trip Records
Core Metrics:
- Trip distance
- Fare amount
- Tip amount
- Tolls amount
- Total amount
- Passenger count
- Trip duration
- Extra charges
🗂️ Dimension Tables
📅 DateTime
Pickup/dropoff times, hour, day, month, year
📍 Location
Pickup/dropoff zones, boroughs, coordinates
💳 Payment Type
Cash, credit card, no charge, dispute
💰 Rate Code
Standard, JFK, Newark, Nassau, negotiated
✅ Benefits of Star Schema
- Query Performance: Optimized joins reduce query execution time
- Business Clarity: Intuitive structure for analysts and stakeholders
- Aggregation Speed: Fast rollups across time, location, and payment dimensions
- Scalability: Easily add new dimensions without restructuring fact table
ETL Pipeline Workflow
1️⃣ Extract
- Download NYC TLC trip data (Parquet/CSV format)
- Upload raw files to GCP Cloud Storage bucket
- Trigger Mage.ai pipeline via Cloud Storage event or schedule
2️⃣ Transform
- Data Cleaning: Remove nulls, duplicates, outliers (negative fares, impossible distances)
- Data Enrichment: Calculate trip duration, speed, revenue per mile
- Dimensional Splits: Extract datetime, location, payment dimensions from fact table
- Type Casting: Convert timestamps, floats, integers to proper BigQuery types
- Validation: Assert data quality rules (fare > 0, passenger count < 10, etc.)
3️⃣ Load
- Load fact table and dimension tables into BigQuery datasets
- Create partitioned tables (by pickup date) for query performance
- Build materialized views for common aggregations
- Schedule incremental loads for new data (append vs. overwrite strategy)
Business Insights & Analytics
💰 Revenue Analysis
- -Total revenue by time period (daily, weekly, monthly)
- -Average fare by pickup location and hour
- -Tip percentage trends by payment type
- -Revenue per mile by rate code
🕐 Demand Patterns
- -Peak hours for trip requests
- -Weekday vs. weekend trip volume
- -Seasonal demand fluctuations
- -Hourly utilization rates
🗺️ Geographic Insights
- -Most popular pickup/dropoff locations
- -Average trip distance by borough
- – Heatmap of high-demand zones
- – Cross-borough travel patterns
👥 Passenger Behavior
- – Average passenger count per trip
- – Solo vs. group travel trends
- – Payment method preferences
- – Tipping behavior by passenger count
Technology Stack
Key Achievements & Outcomes
📋 Technical Highlights:
- Star schema data modeling for optimal query performance
- Partitioned BigQuery tables reducing scan costs by 90%+
- Automated data quality validation in ETL pipeline
- Version-controlled SQL queries and Python scripts in GitHub
- Incremental load strategy for daily data updates
- Cost-optimized cloud resource allocation
Sample Analytics Queries
SUM(total_amount) AS total_revenue,
COUNT(*) AS trip_count
FROM fact_trips
JOIN dim_location ON fact_trips.pickup_location_id = dim_location.location_id
GROUP BY pickup_location_id, location_name
ORDER BY total_revenue DESC
LIMIT 10;
AVG(fare_amount) AS avg_fare,
AVG(tip_amount) AS avg_tip,
AVG(tip_amount / fare_amount * 100) AS avg_tip_percentage
FROM fact_trips
JOIN dim_payment_type ON fact_trips.payment_type_id = dim_payment_type.payment_type_id
GROUP BY payment_type_name;
View Project on GitHub
Complete source code, SQL queries, Mage.ai pipelines, and documentation available on GitHub.
Need a Data Engineering Solution?
I build scalable ETL pipelines, data warehouses, and analytics platforms on GCP, AWS, and Azure.