

Building Scalable AI, Data, and Automation Solutions
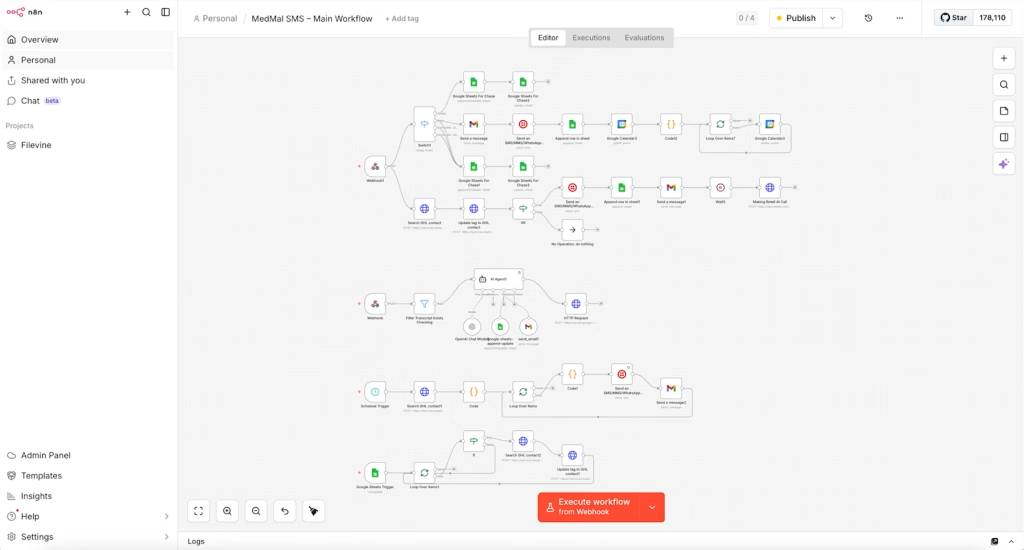
Seeking new opportunities, I am an AI and Data Engineer specializing in Generative AI, AI agents, LLM/RAG systems, data engineering, MLOps, and workflow automation. With 8 years of experience, including 5 years in Full-Stack Development and the last 3 years focused on AI and Data, I build scalable, end-to-end solutions across intelligent automation, cloud systems, and modern data platforms. I work on AI-powered applications, agentic workflows, ETL/data pipelines, and production-ready cloud solutions using technologies such as LangChain, LangGraph, n8n, OpenAI, Claude, FastAPI, AWS, GCP, and Azure. Passionate about combining data, AI, and automation, I bring a practical, impact-driven approach to building reliable systems that solve real-world problems.
Pankaj | AI & Data Engineer | Agentic AI, MLOps
Pankaj | AI & Data Engineer | Agentic AI, MLOps 


Visited 35 times, 1 visit(s) today